Saving for Retirement
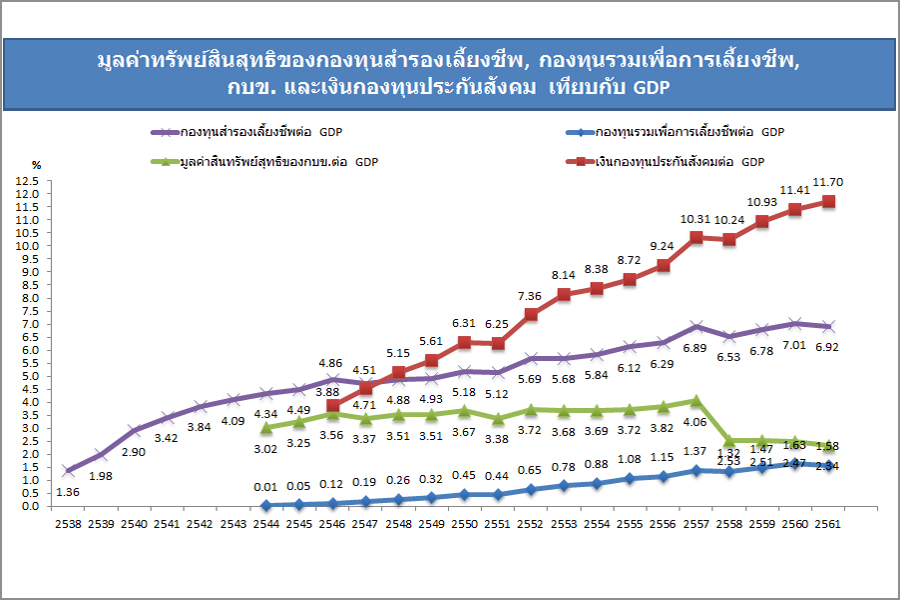
Net Asset Value (of PVD, RMF, GPF, SSO) as Percentage to GDP (Year 1995 – 20118)
Last Update : 6 February 2020
Number of Employers Providing PVD and Number of Companies Registered with the Ministry of Commerce
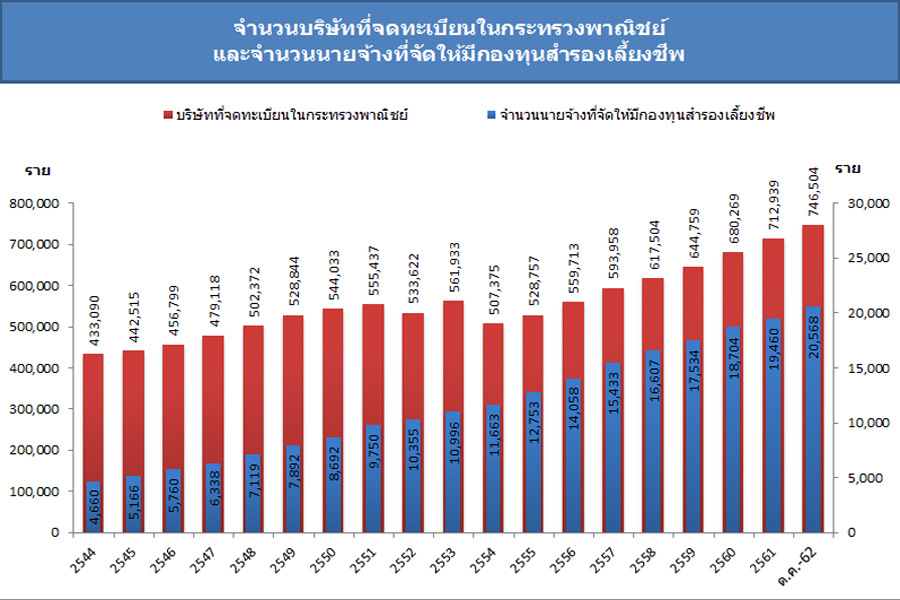
Number of Employers Compared to Number of Companies Registered with the Ministry of Commerce
Last Update : 6 February 2020
Number of Employees Having PVD and Number of Employed Persons in Various Categories
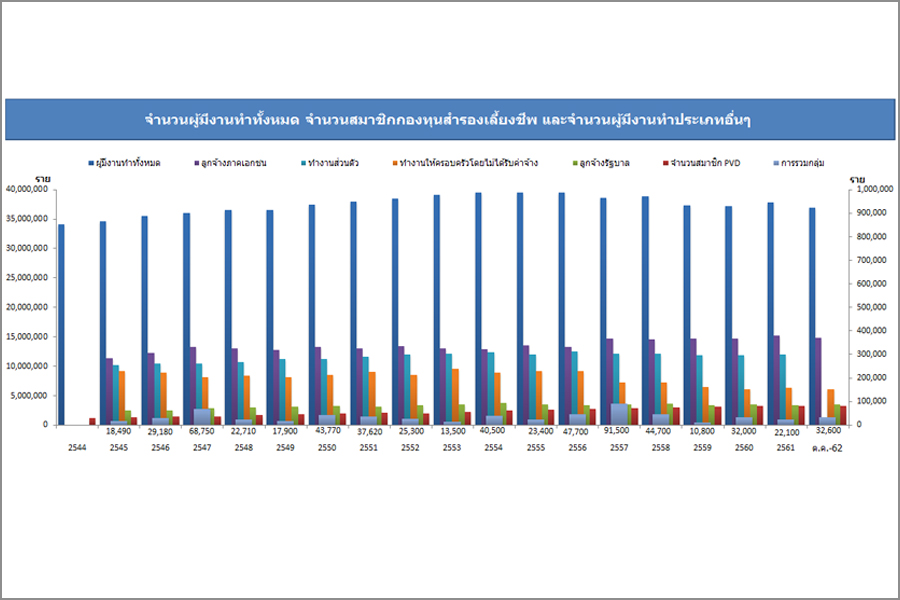
Number of Total Employed Persons, PVD Members, and Employed Persons in Various Categories
Last Update : 6 February 2020
Statistics on Provident Funds
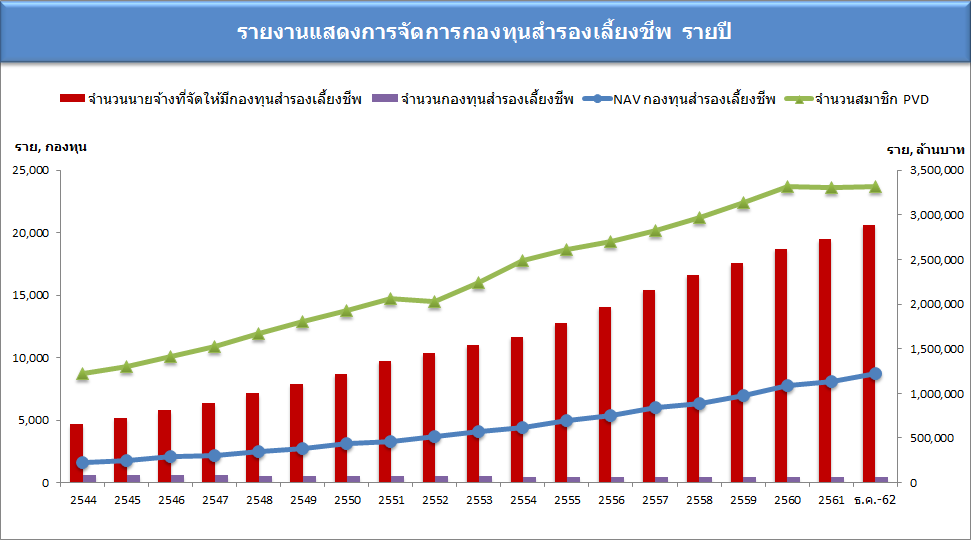
Statistics on Provident Funds (Year 2001 – 2019)
Last Update : 6 February 2020
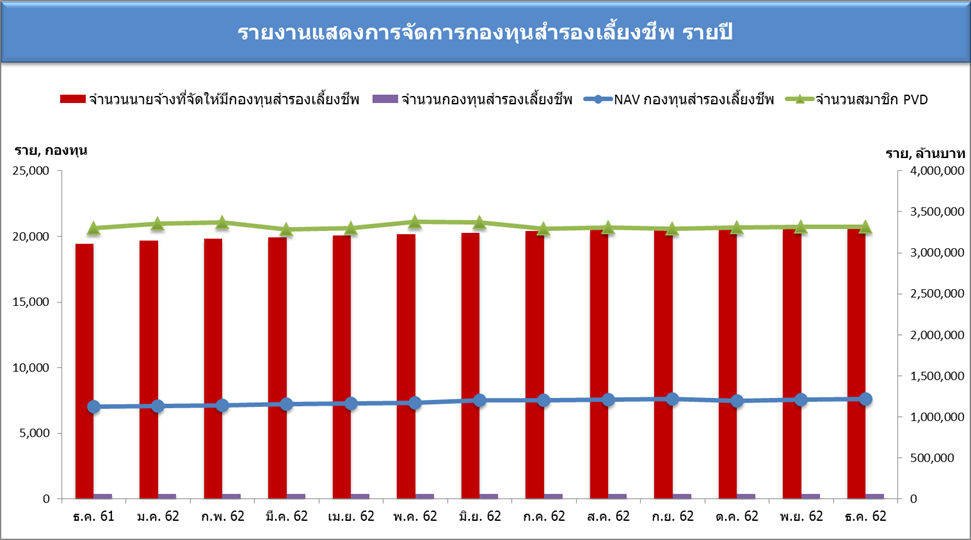
Statistics on Provident Funds
Last Update : 6 February 2020
Asset Allocation of Provident Funds
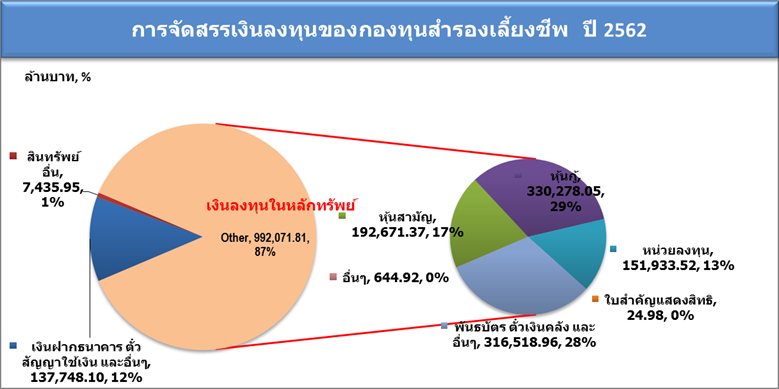
Asset Allocation of Provident Funds (Year 2019)
Last Update : 6 February 2020
Market Share
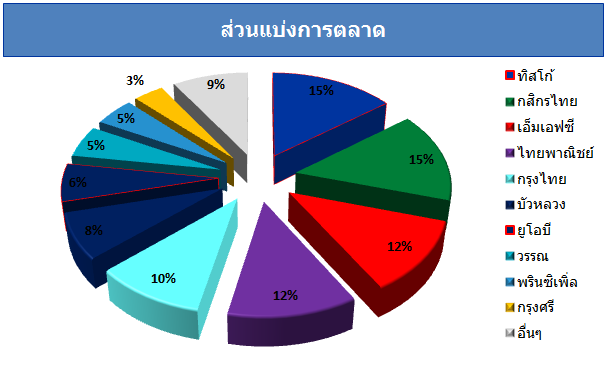
Market Share of Provident Funds (by Asset Management Company)
Last Update : 6 February 2020


